

A developer and an operations lead in a Riyadh office look at charts on a monitor while a phone shows an alert.

Vercel · Core platform

A customer tells you the form is broken. See the error, the route and the log before they call.

Today you find out from a WhatsApp message, and the developer starts by asking which page. Observability comes with every Vercel plan. It shows errors, slow routes, function and external API calls, and AI Gateway traffic in one dashboard. On Pro and Enterprise, alerts flag the spike. Observability Plus keeps 30 days and lets you query the logs.

Salesforce consulting partner since 2010 · MVP Hall of Fame · 200+ agents in production · UAE, India and US desks

The problem

How you find out about errors today.

What Observability is

Observability, in plain words.

Facts from Vercel’s own pages, checked on 16 October 2026. The sources are at the end of this page.

What it is
Production errors, request traces and metrics, from the dashboard or the Vercel CLI. Available on every plan.
What it covers
Functions, external APIs, CDN requests, middleware, images, ISR, Blob, builds, AI Gateway, Queues and AI traffic.
How long it keeps data
Without Plus: 12 hours on Hobby, 1 day on Pro, 3 days on Enterprise. With Observability Plus: 30 days.
Observability Plus
On by default for teams on paid Pro from 3 April 2026, not in the Pro Trial. Billed per event; projects can be excluded.
Alerts
Anomaly detection and alerting, labelled Pro and Enterprise.
Export
OpenTelemetry traces and log drains to tools such as Datadog and New Relic.

How it works

From an error to the line that caused it.

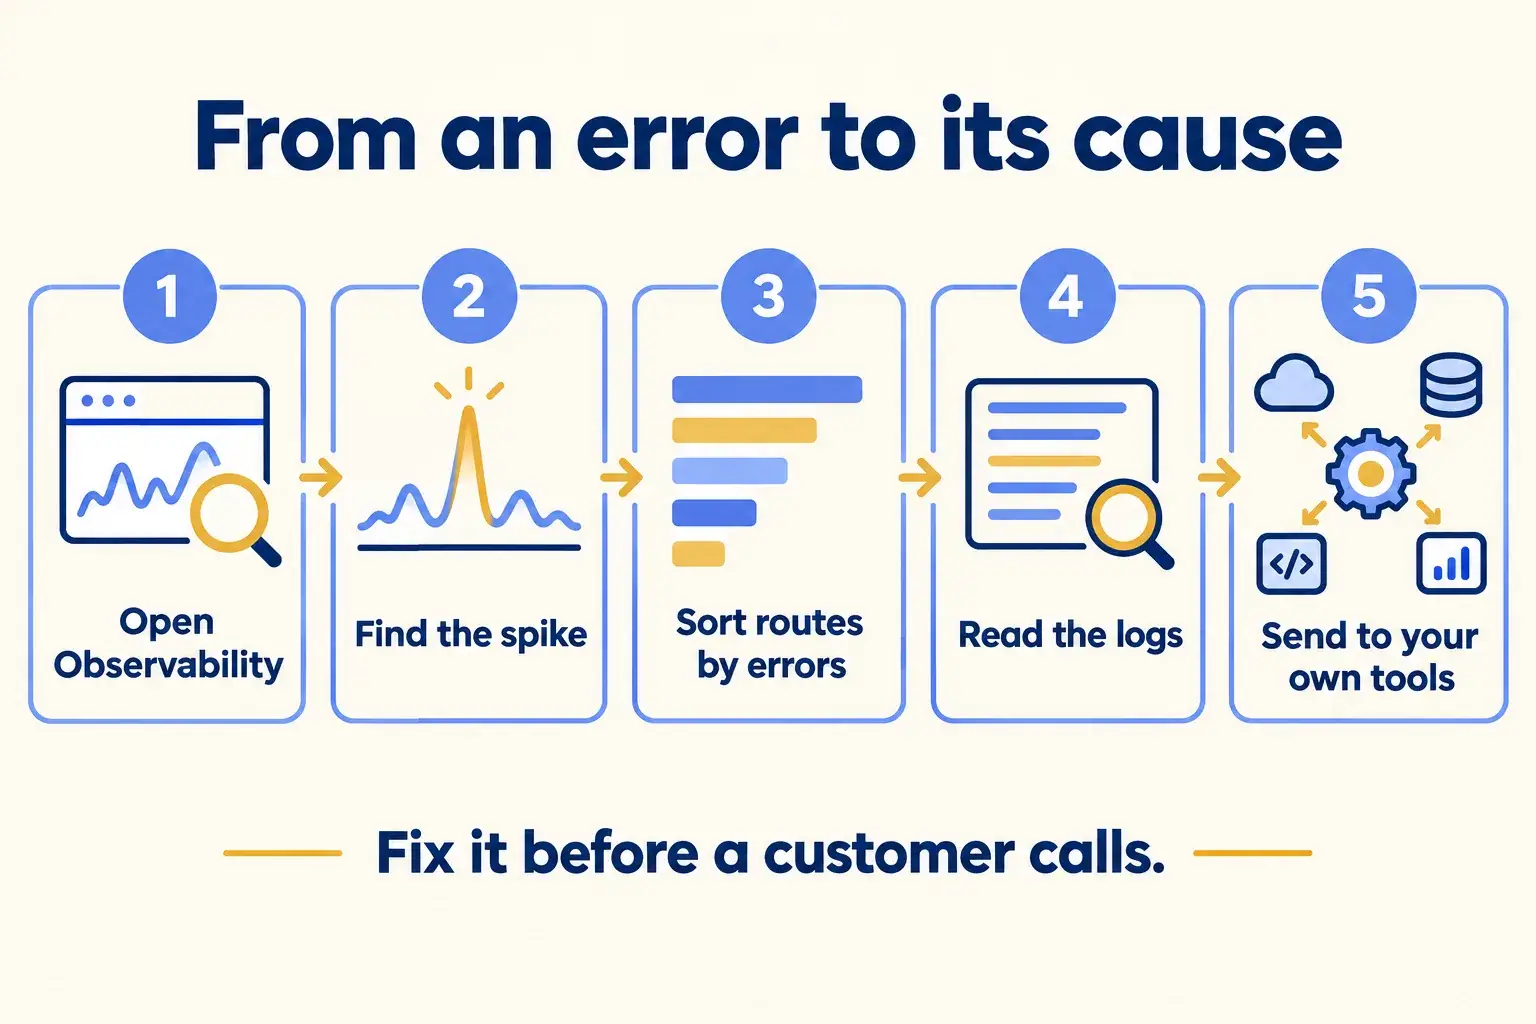
Five steps. Start from the spike, narrow it to one route, read the log, and send the same data to the tools your team already uses.

Five steps: open Observability, spot the error spike, sort routes by errors, read the logs, send data to your own tools.

Infographic

The same steps are written out below.

Step by step

What happens at each step.

  1. Open

    Open Observability

    In the project or team dashboard. Pick a feature, such as Functions, and a time range.

  2. Spot

    Find the spike

    Zoom into the error rate. On Pro and Enterprise an alert flags it first.

  3. Sort

    Sort routes by errors or latency

    Latency per path needs Observability Plus.

  4. Read

    Jump to the logs

    See the request and the error for that function. With Plus, save the query to a notebook.

  5. Share

    Send it to your own tools

    Drain logs and traces to Datadog or another tool your team uses.

How it fits together

Where Observability sits across your site, functions and systems.

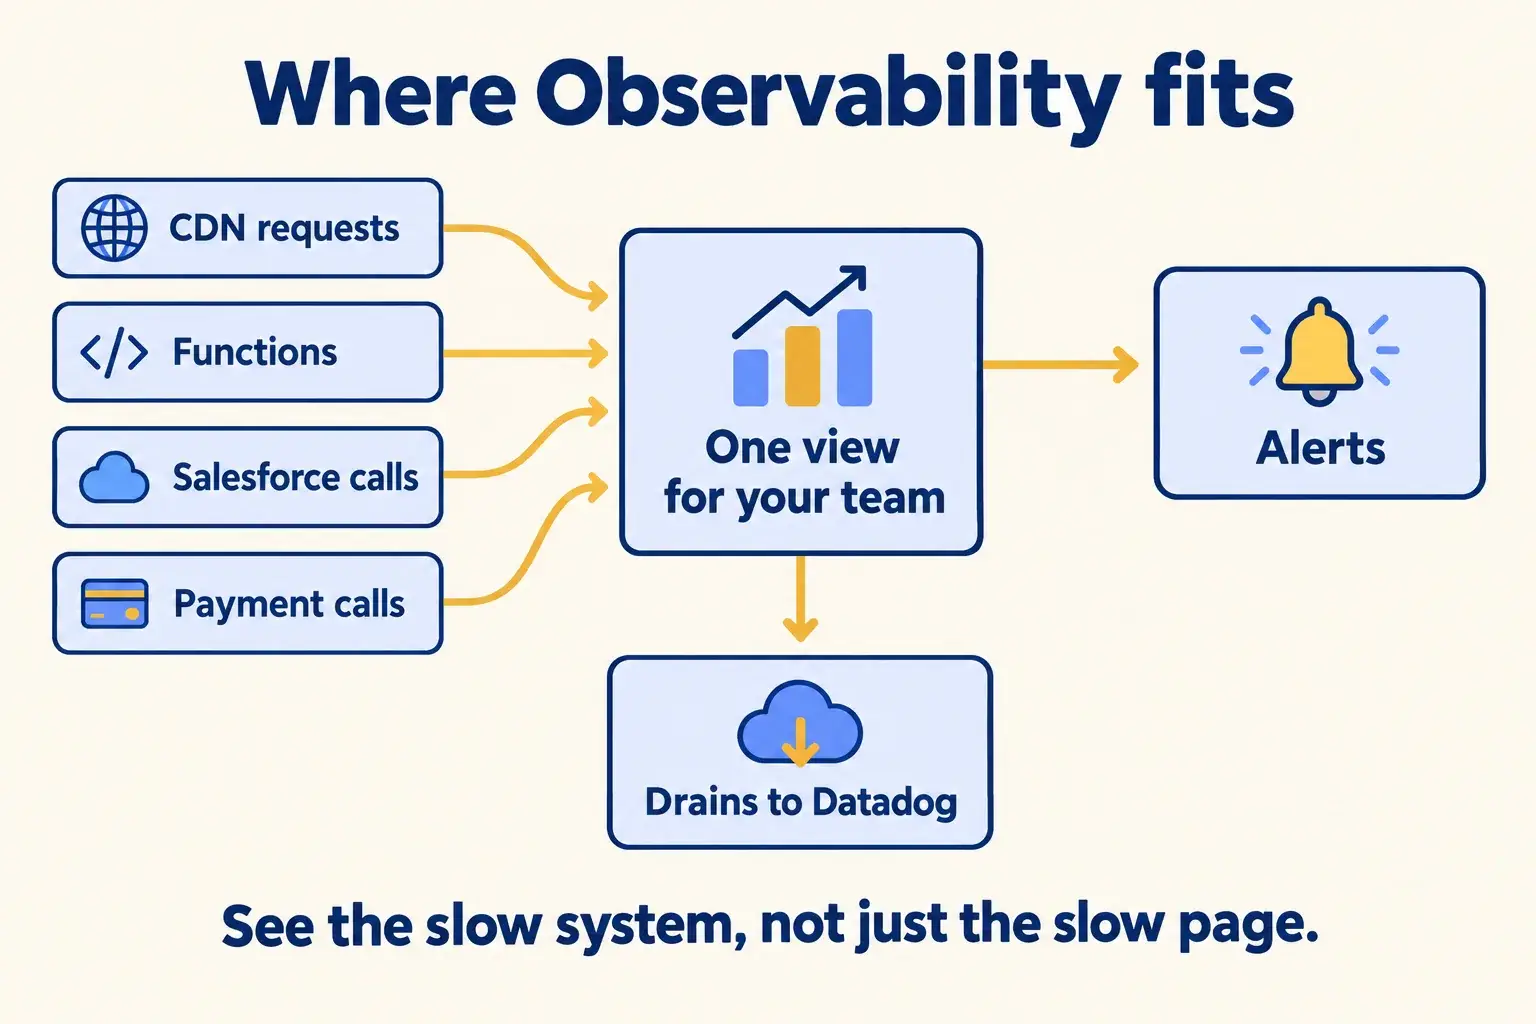
It reads from the CDN, your functions and the calls they make to Salesforce, WhatsApp or a payment provider. Your team sees one view. If you already use Datadog or New Relic, traces and logs go there too.

CDN requests, functions, Salesforce calls and payment calls feed one Observability view, with alerts and drains to Datadog.

Infographic

Where it sits next to the systems you run today.

Use cases · worked examples

One worked example in each industry.

How Observability fits into the work of the industries we serve, one step at a time.

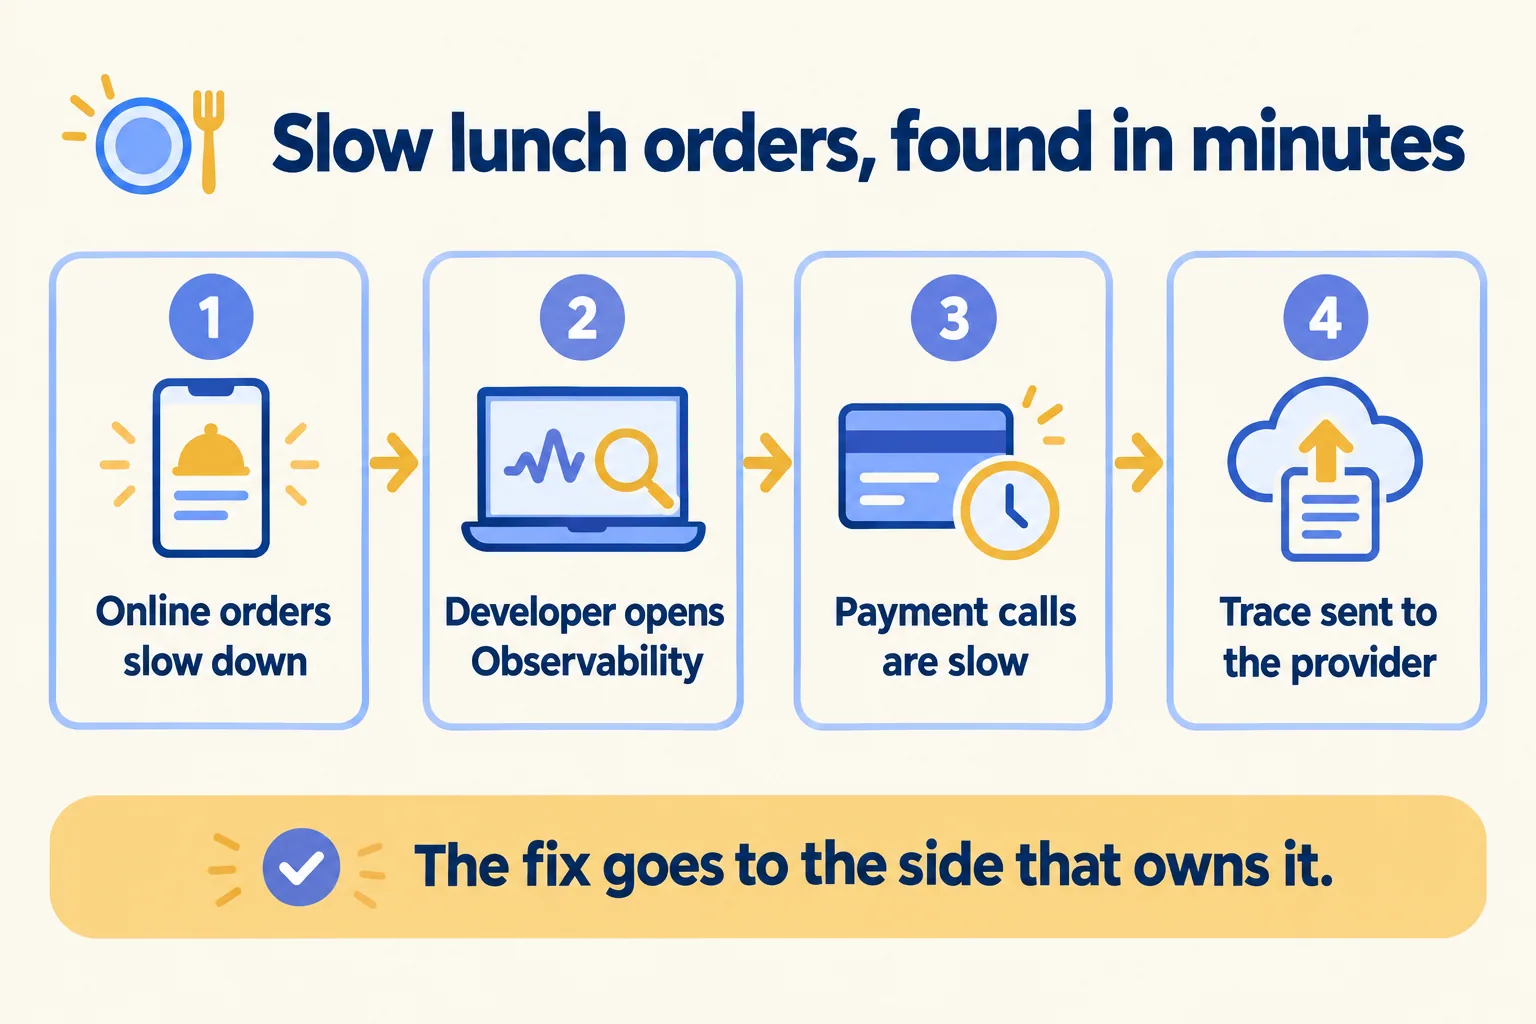
  1. A lunch rush flow: orders slow, developer opens Observability, payment calls are slow, the trace goes to the provider.

    Example 1 · Restaurants, Dubai · Infographic

    Operations manager at a Dubai restaurant group with online ordering

    Today: At lunch, online orders slow to a crawl. The developer blames the payment provider, the provider blames the website, and nobody has the numbers.

    After: Observability shows the external API calls from the order function. The slow call is the payment provider’s, at the lunch peak, and the trace shows it.

    Worked example, step by step

    1. 12:30Customers. Place lunch orders on the website.
    2. 12:40Ops manager. Hears from two branches that online orders are slow.
    3. 12:42Developer. Opens Observability, Functions, last hour. Errors are flat, the order route is slow.
    4. 12:45Developer. Opens External APIs. Calls to the payment provider take most of the time.
    5. 13:30Ops manager. Sends the trace to the payment provider and asks for their status.
    6. 14:00Developer. Adds a timeout and a WhatsApp order link if payment does not answer.

    The argument ends with a trace, and the fix goes to the side that owns it.

    Restaurants and cafes
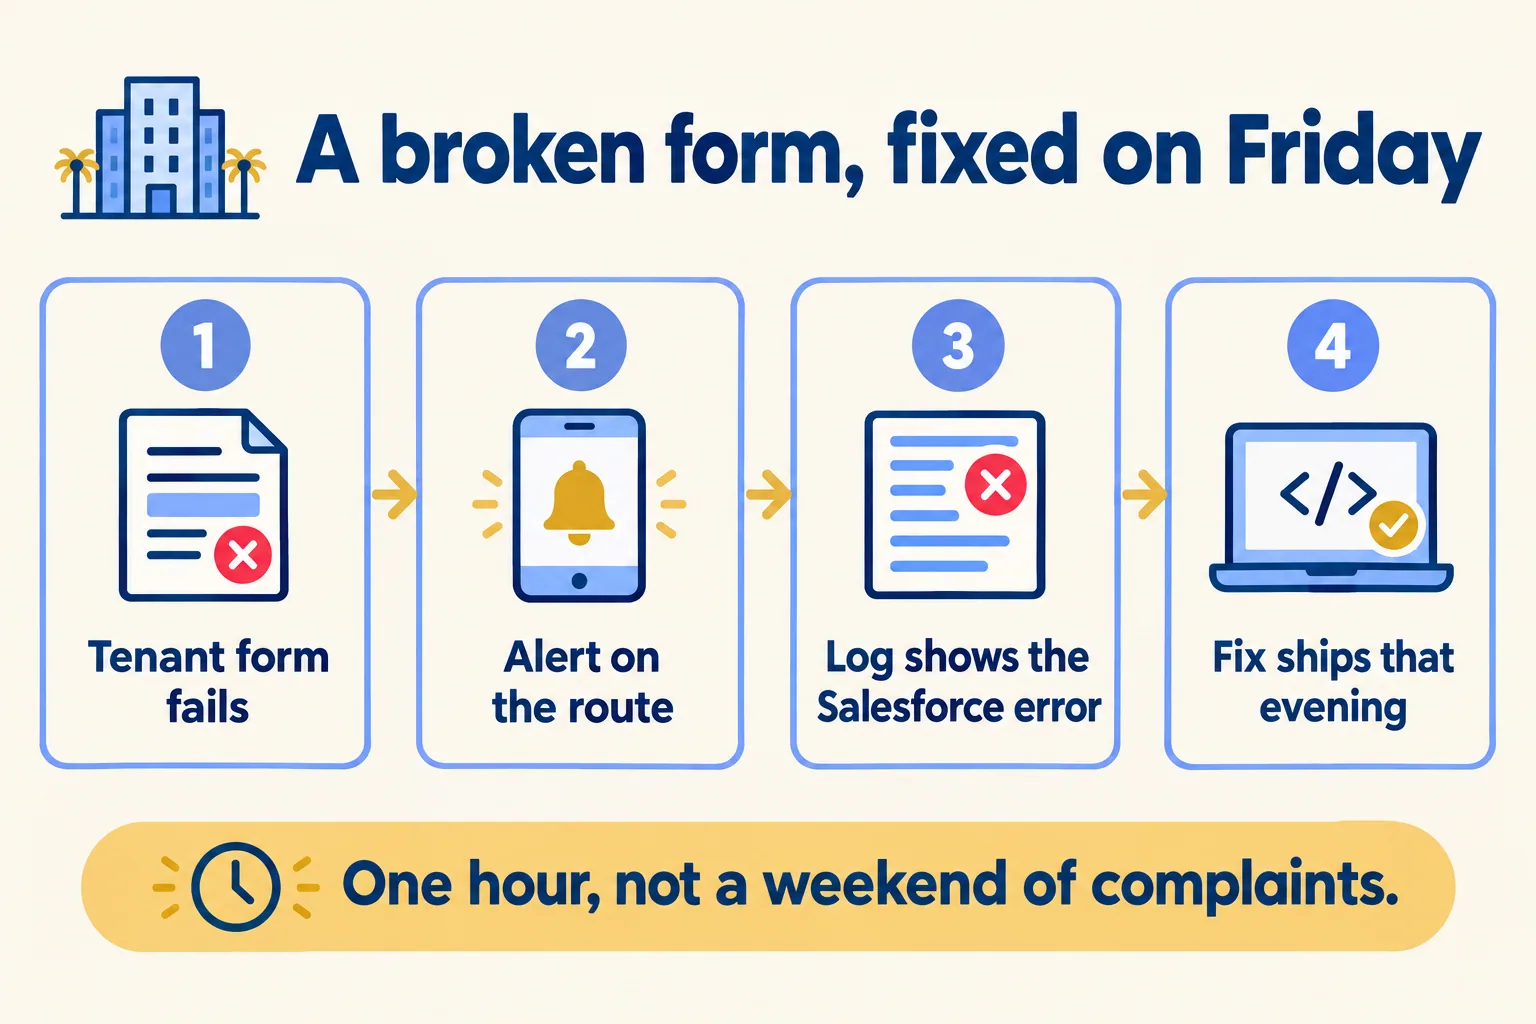
  2. A tenant portal flow: a form fails, an alert fires, the log shows the Salesforce error, the fix ships that evening.

    Example 2 · Property management, Abu Dhabi · Infographic

    Head of tenant services at an Abu Dhabi property manager

    Today: Tenants log maintenance requests on the portal. Last month the form stopped saving on a Friday and nobody knew until Sunday, when the complaints came in.

    After: An alert flags the error spike on the request route. The logs show the Salesforce call failing after a field was renamed.

    Worked example, step by step

    1. Fri 18:05Admin. Renames a field on the Case object in Salesforce.
    2. Fri 18:10Tenant. Submits a leak report. The portal shows an error.
    3. Fri 18:20Observability. Sends an alert: errors on the maintenance route are up.
    4. Fri 18:30Developer. Opens the logs. Salesforce rejects the old field name.
    5. Fri 19:00Developer. Maps the new field, checks it on a preview, and ships the fix.
    6. Fri 19:10Tenant services. Calls back the tenants whose requests failed, from the log.

    A broken form costs one Friday evening hour instead of a weekend of complaints.

    Property management
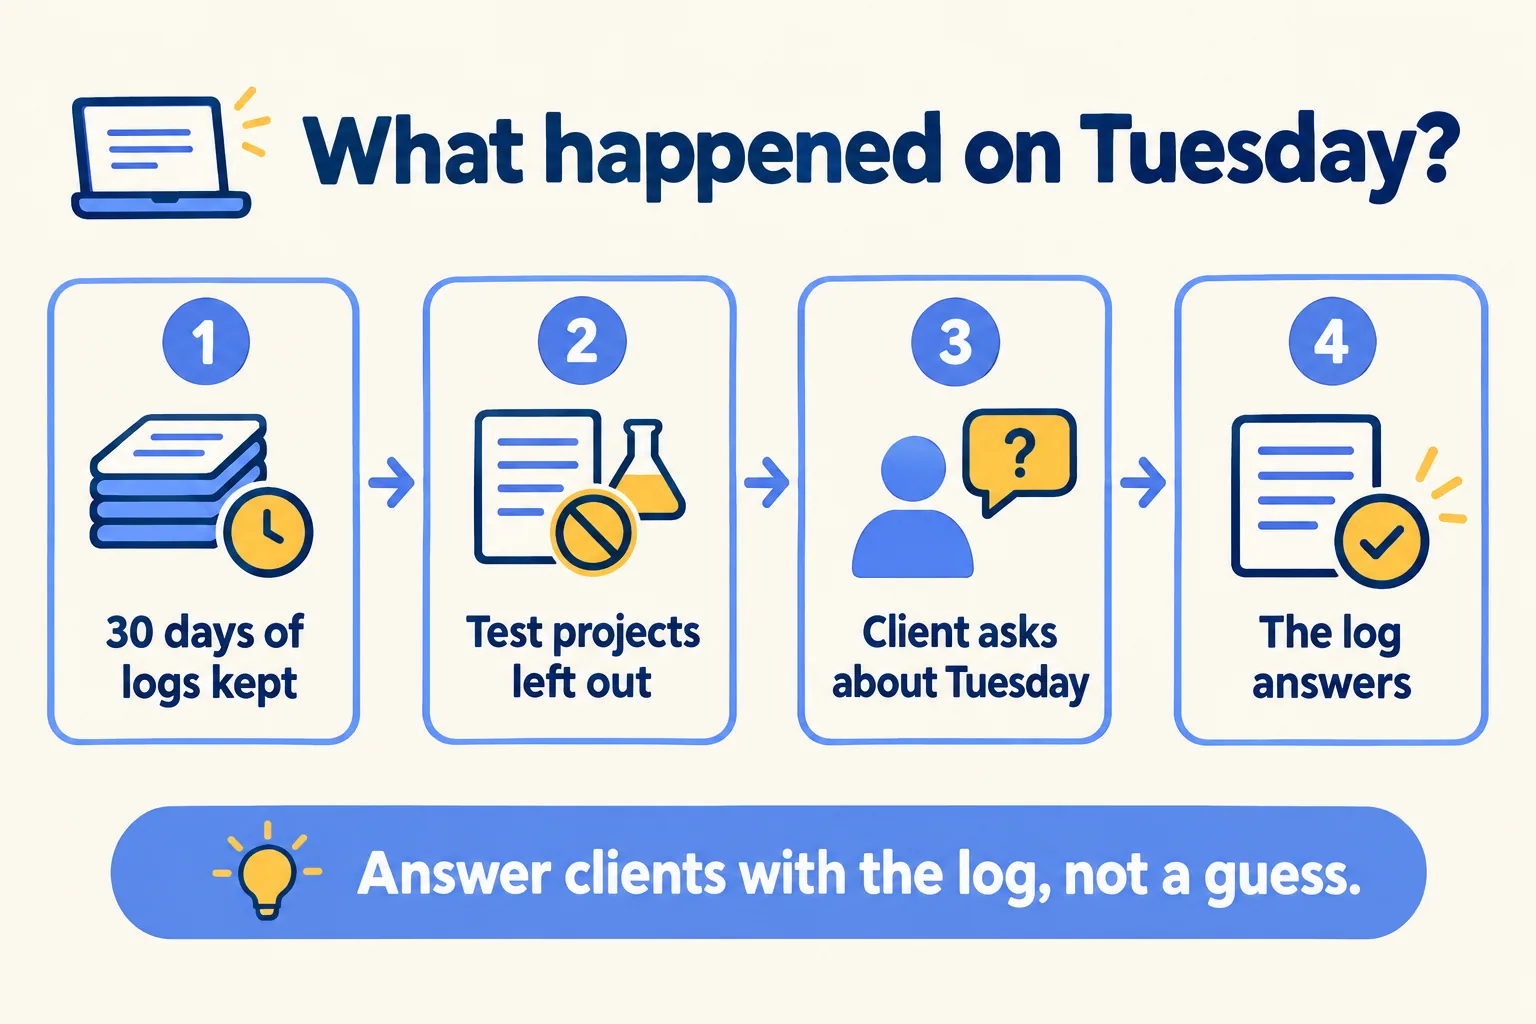
  3. An agency flow: Observability Plus on, test projects excluded, a client asks about Tuesday, the log answers.

    Example 3 · Digital agencies, Bengaluru · Infographic

    Delivery head at a Bengaluru digital agency that runs client sites

    Today: Twenty client sites sit on one Vercel team. A client asks why their contact page failed on Tuesday, and the logs only go back a day.

    After: Observability Plus keeps 30 days. The agency excludes its test projects to control events, and drains logs to the Datadog account it already pays for.

    Worked example, step by step

    1. Week 1Developer. Turns on Observability Plus for the team and excludes the test projects.
    2. Week 1Developer. Sets up a log drain to the agency’s Datadog account.
    3. Tue 14:00Client site. The contact page returns errors after a content update.
    4. Thu 10:00Client. Asks what happened on Tuesday.
    5. Thu 10:15Delivery head. Queries Tuesday’s logs and saves the query to a notebook.
    6. Thu 11:00Developer. Fixes the page and adds an alert on that route.

    The agency answers the client with Tuesday’s log, and the next failure raises an alert.

    Digital agencies
Examples of the work, not client stories. Times in each example show the order of events, not a measured result.

Is it for you

When Observability fits, and when it doesn’t.

Good fit

Not for you yet

Customers find your errors before you do
Rules require logs stored in the UAE: Vercel does not state where they are kept
Your app calls Salesforce, WhatsApp or a payment API
You want alerts on Hobby: they are Pro and Enterprise
You need last week’s logs, not just today’s
The app does not run on Vercel
You run on Vercel Pro or Enterprise, or are moving there
You need 30-day logs without paying for Plus

What Mindcat does

We build it, then we run it.

The assessment is free: a short read of the org and a written note. If you go ahead, the first build week is a fixed AED/SAR 14,900 (about USD 4,050), credited in full when you sign the build within 60 days. After go-live, we keep it patched, watched and changing every month.

FAQ

What teams ask about Observability.

Is it included in the plan?
Observability is on every plan. Observability Plus is $1.20 per million events as of 16 October 2026, and is on by default for teams created or upgraded to paid Pro from 3 April 2026. You can exclude projects to keep the count down.
How far back can we look?
Without Plus, 1 day on Pro and 3 days on Enterprise. With Plus, 30 days, and a runtime log search covers up to 14 days at a time.
Do we get alerts on Hobby?
No. Vercel labels alerting as Pro and Enterprise. Hobby is also for non-commercial use only, so client work runs on Pro or Enterprise anyway.
Can logs go to our own tools?
Yes. Log drains and OpenTelemetry traces go to tools such as Datadog and New Relic. Drains are $0.50 per GB on Pro as of 16 October 2026.
Where are the logs stored?
Vercel does not state where log and telemetry data is kept. If your rules need logs in a set country, we drain them to a store you choose and write that down in the handover.

Sources

Where these facts come from.

Start here

Tell us what you want built, and where it runs today.

One or two lines is enough. You hear back within 24 hours from the person who signs the work.

Salesforce consulting partner since 2010 · MVP Hall of Fame · 200+ agents in production · UAE, India and US desks